Richard Wheeler Works!

Open Source Borders for Bureaucracksy Bed Time Stories

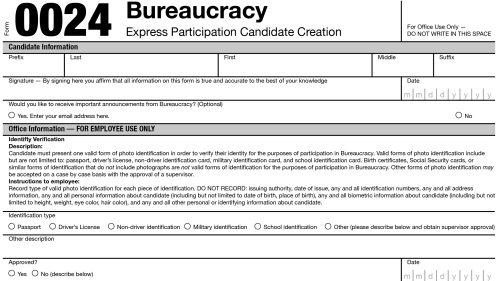
Bureaucracksy
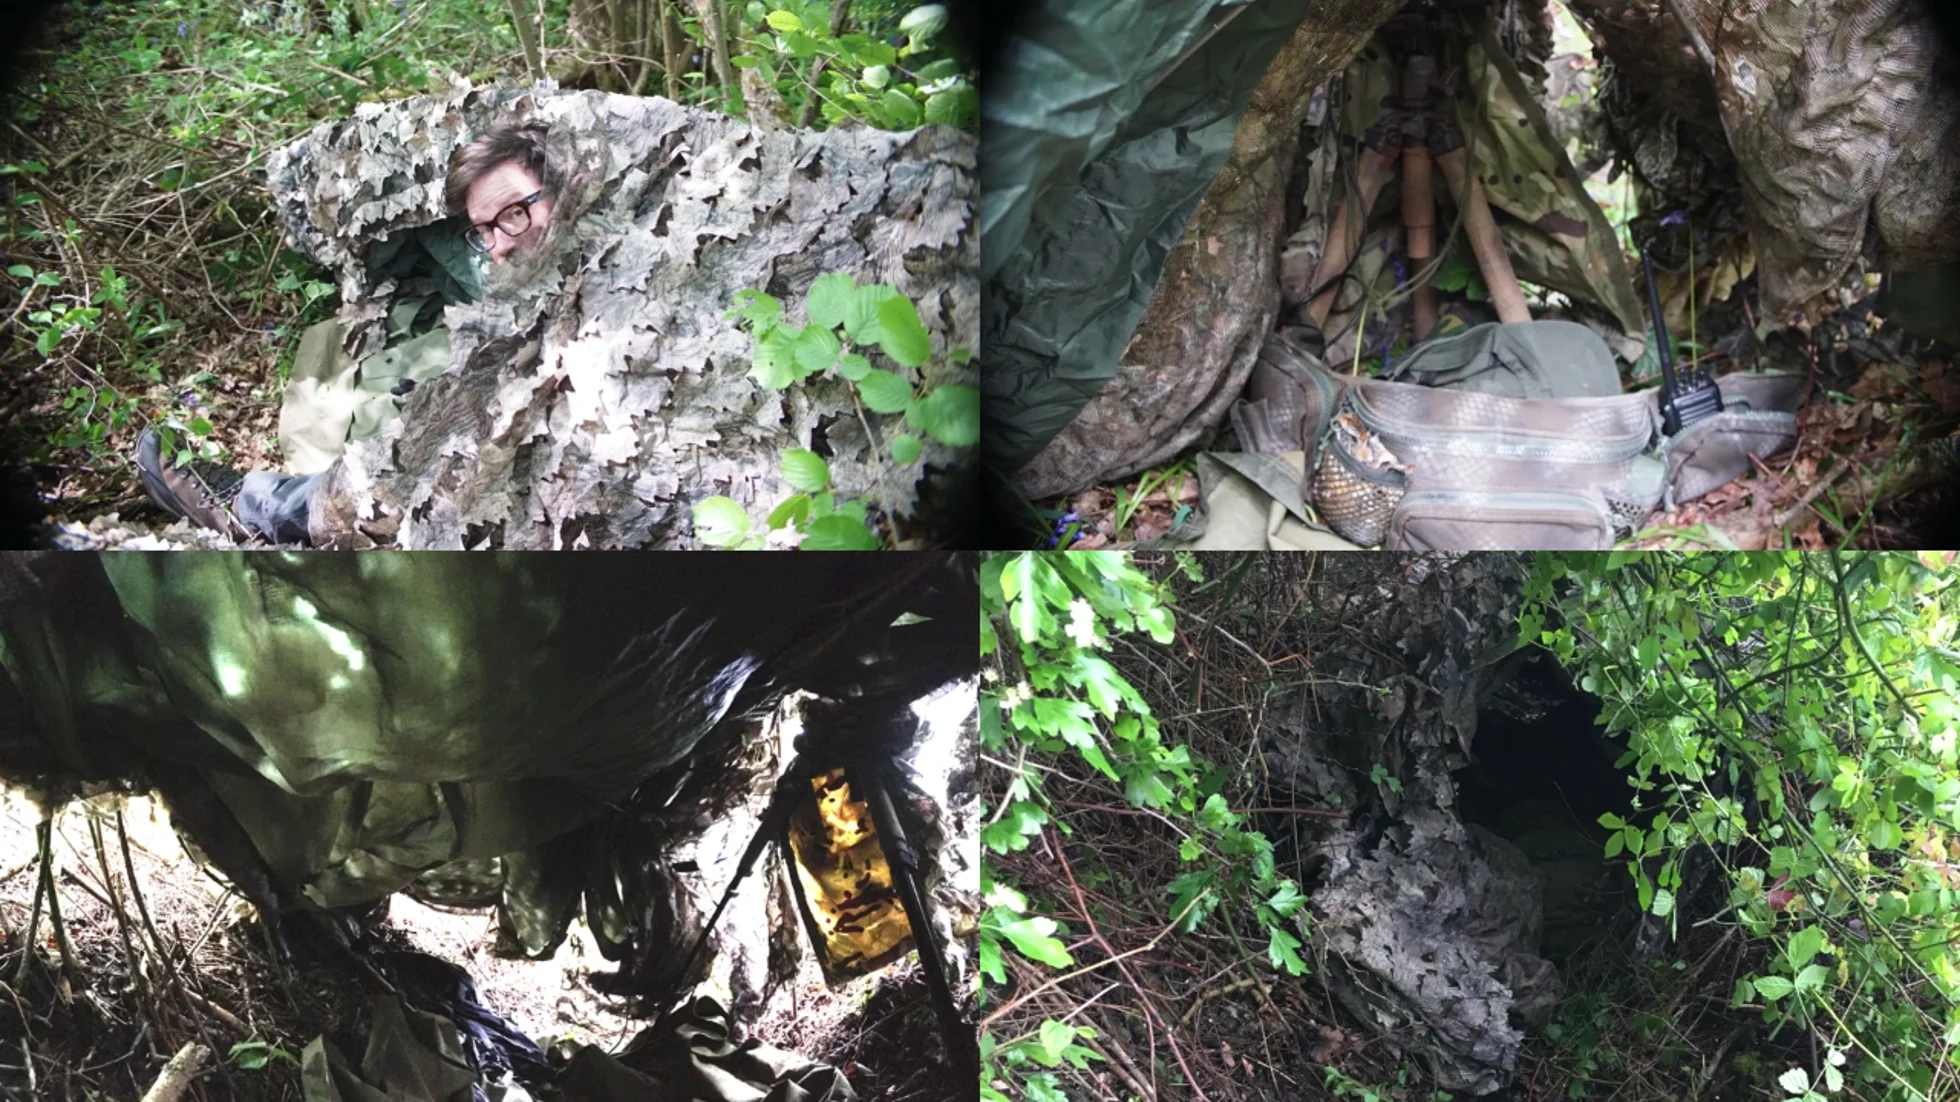
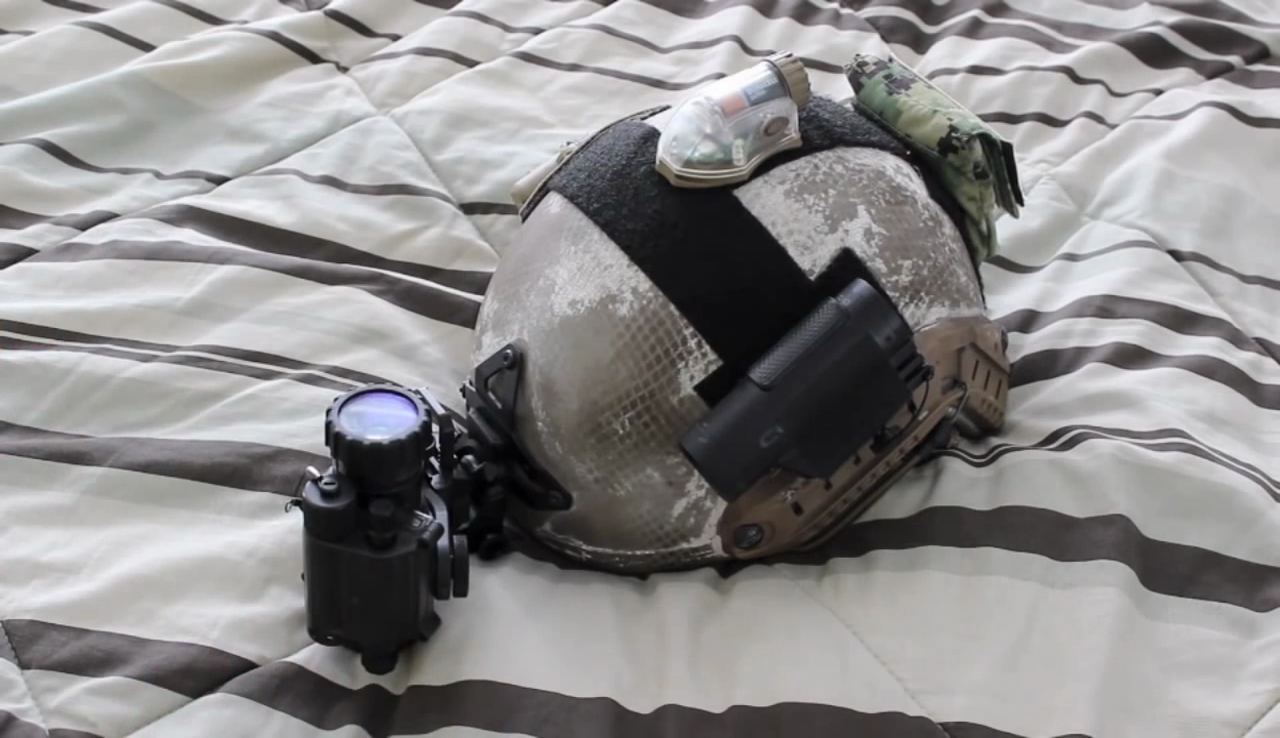
If I Could See What You See
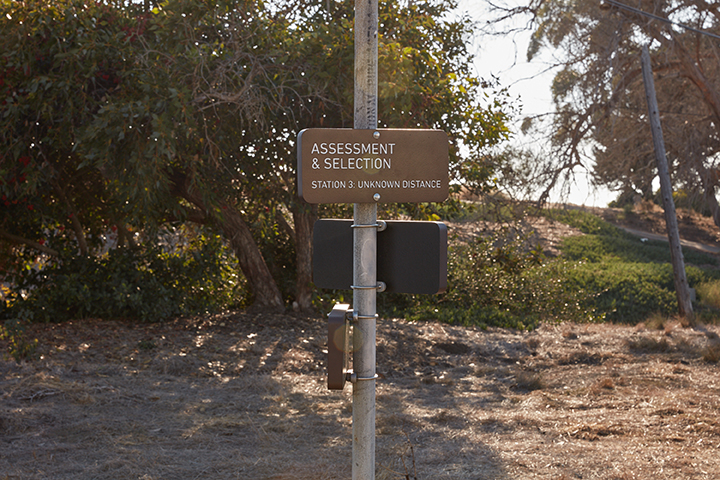
Assessment and Selection, Phase 1
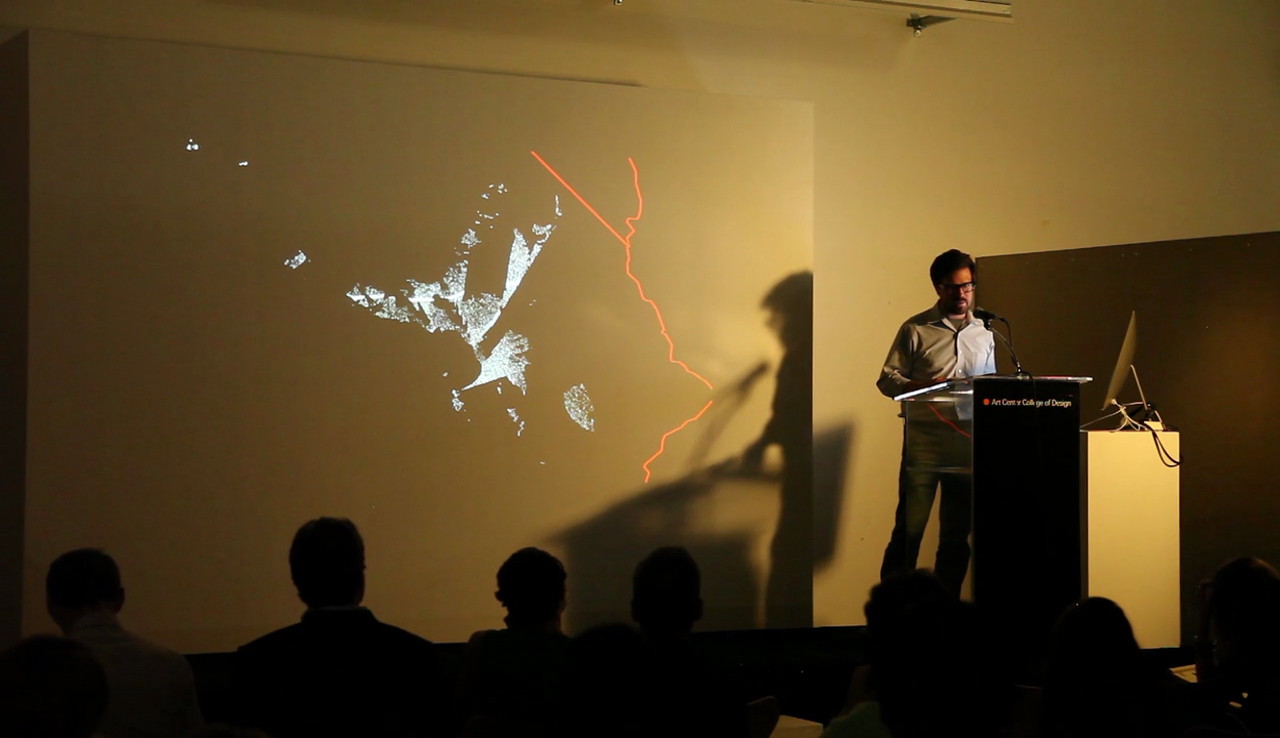
Art Center College of Design Media Design Practices Summer Residency
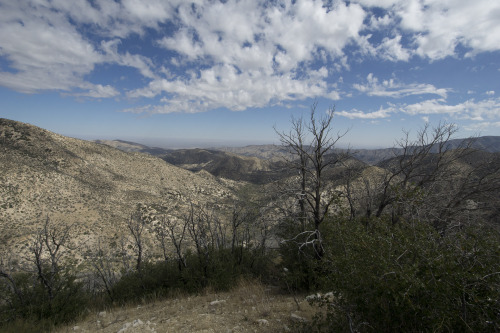
Background of the Angeles National Forest
Indexical Landscapes talk
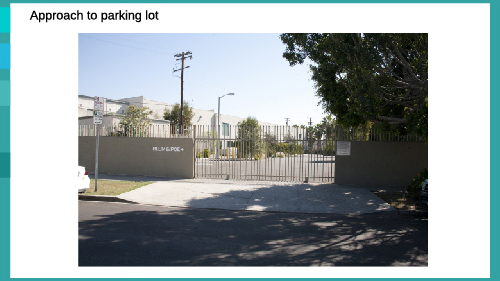
Points of Interest
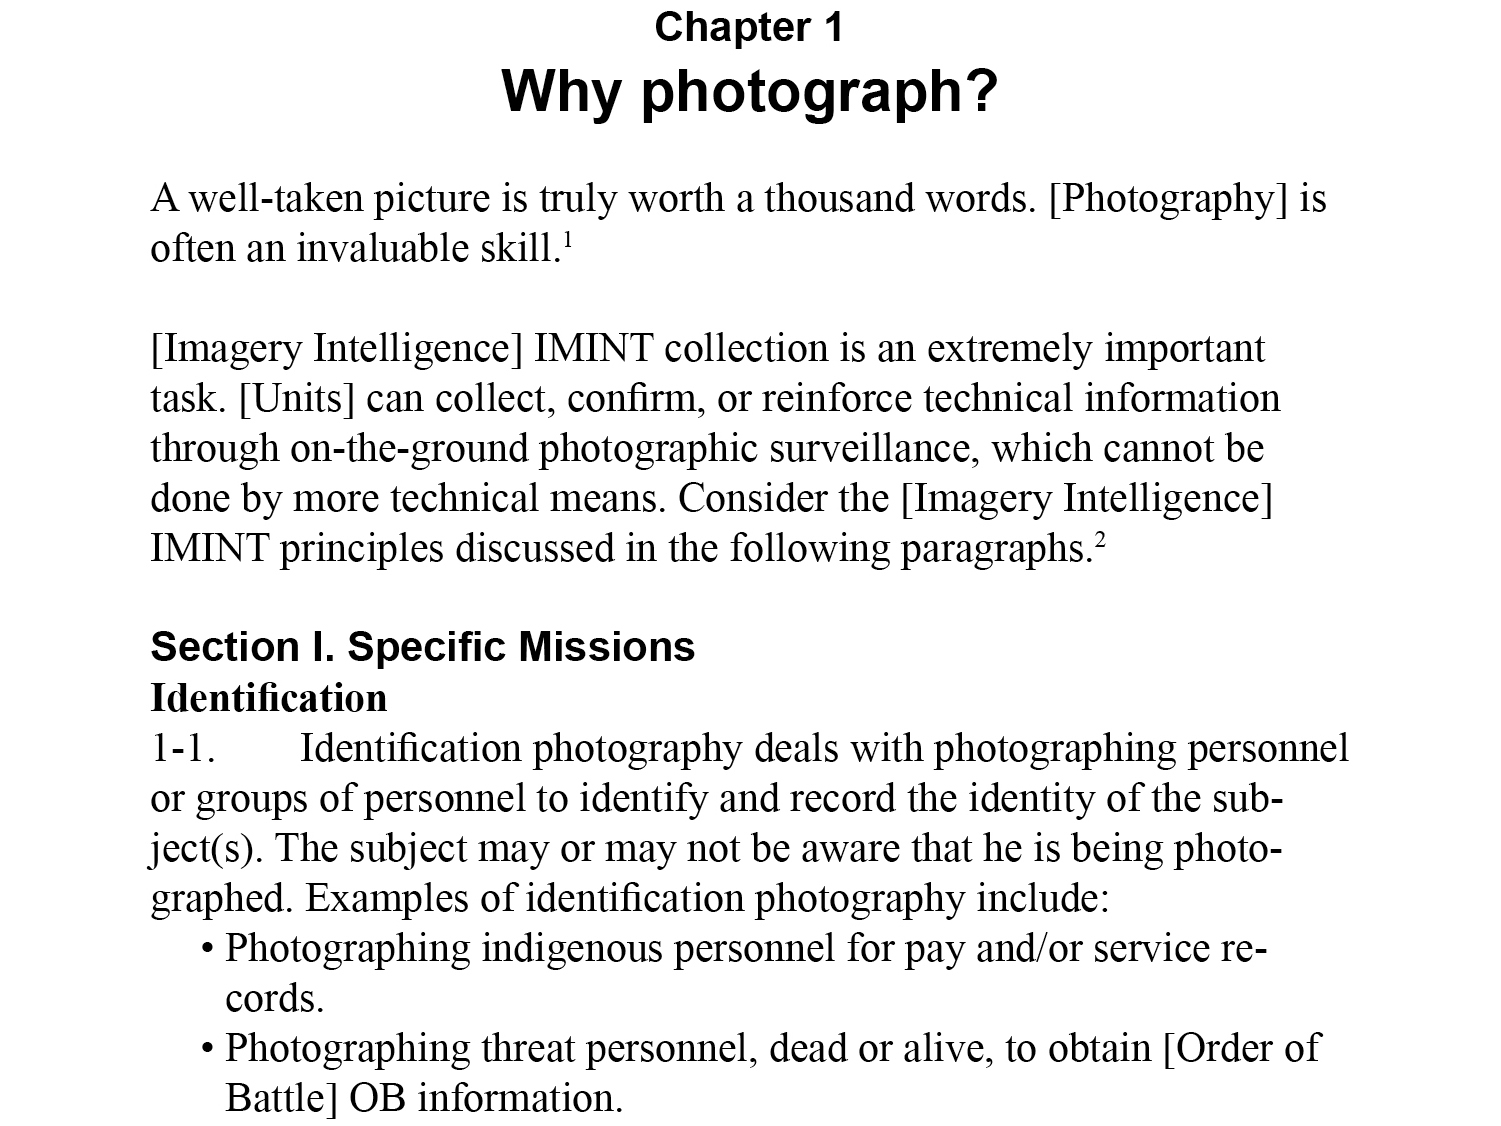
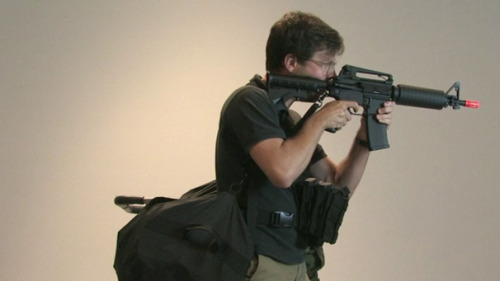
MM1-1.1 Photograph (Intelligence)
La Nuit Americaine
Walk This Way

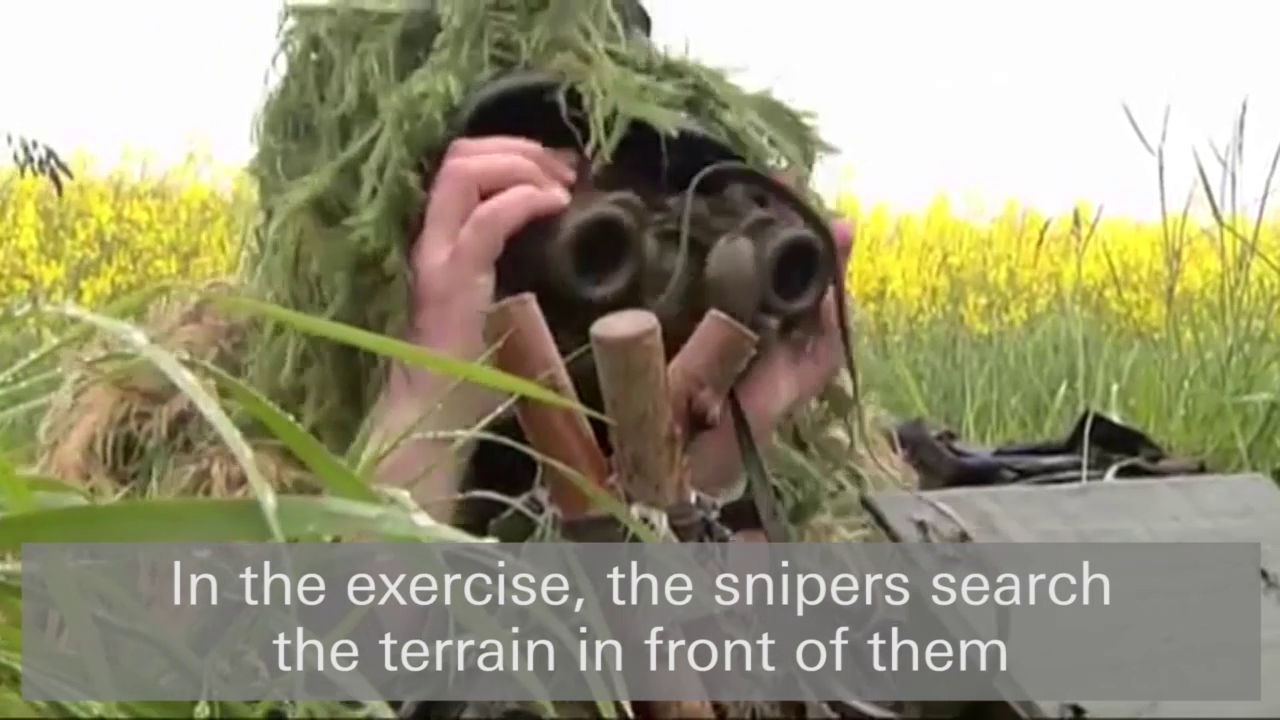
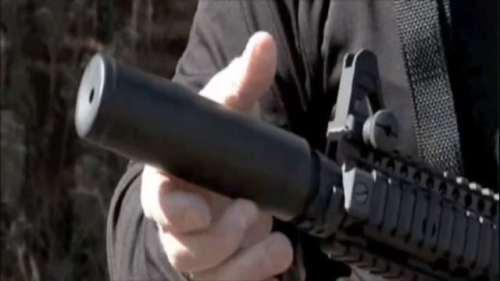
The Sounds of Silencers
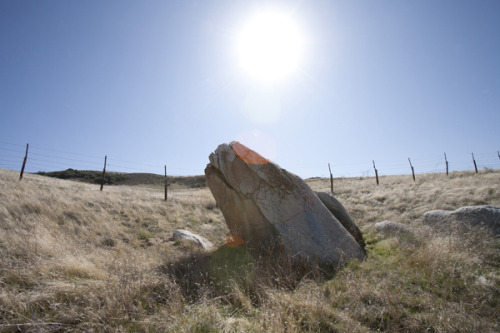
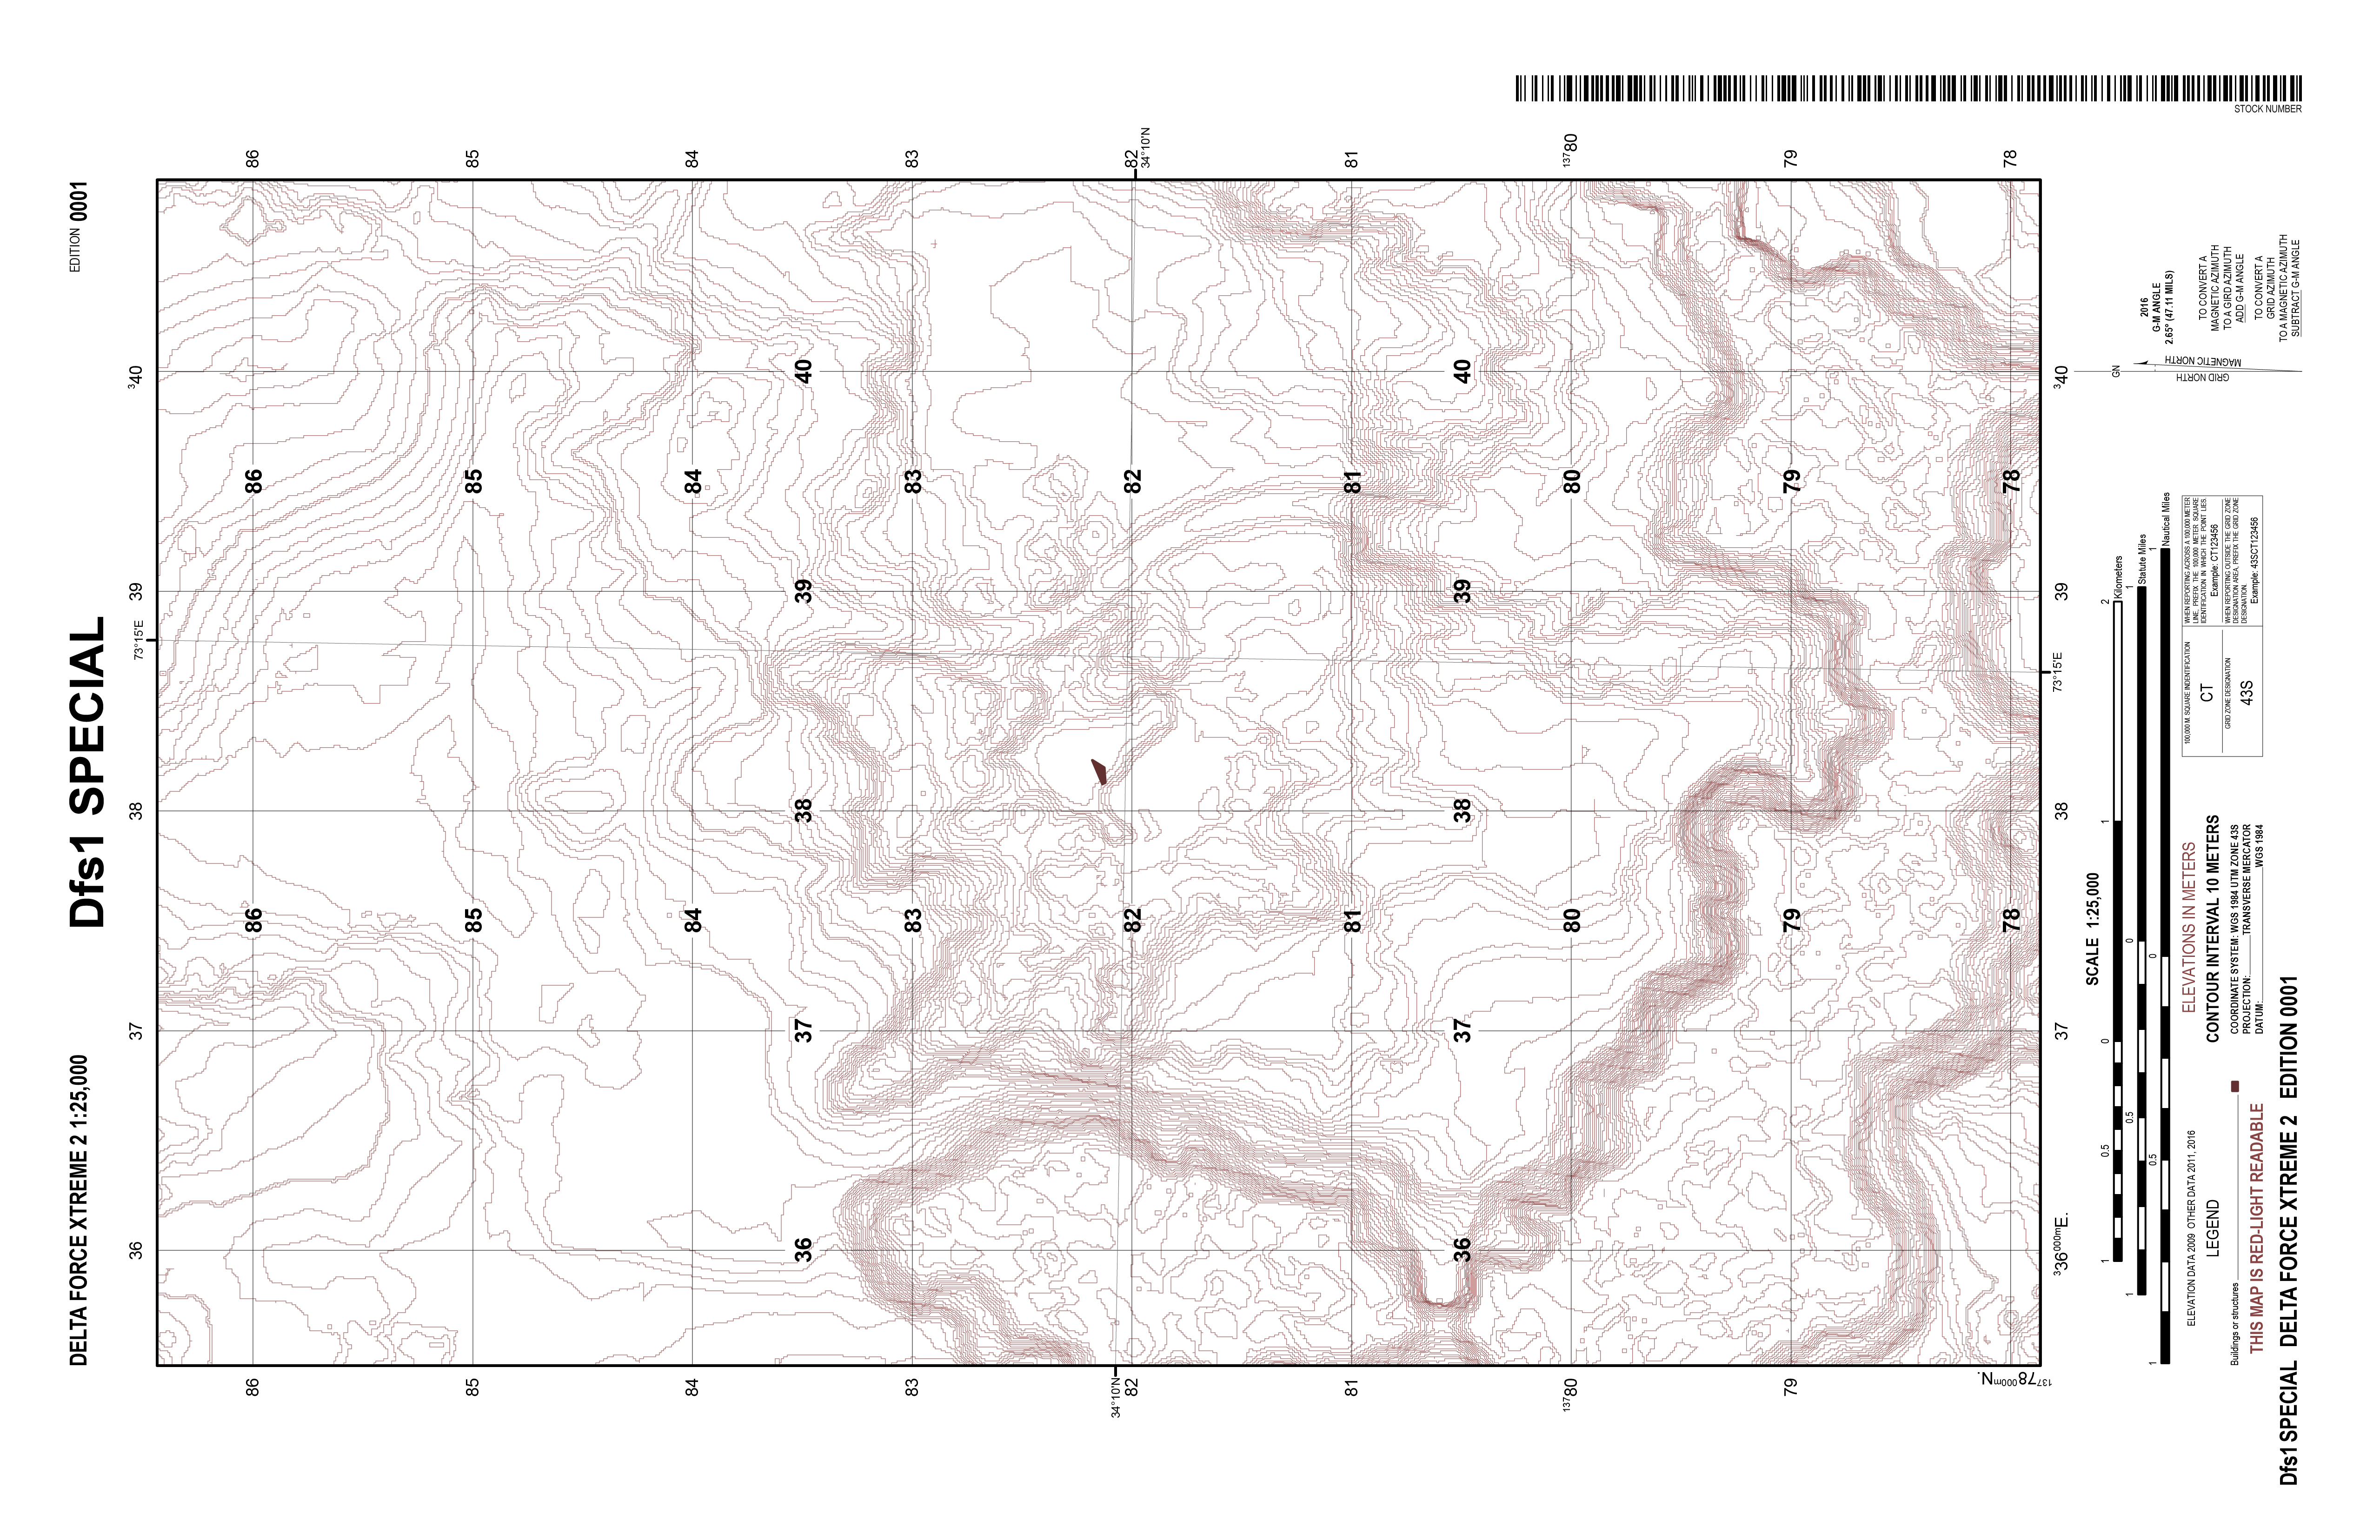
Grid reference 43S CT 38006 82324
Cards For Justice

Tasks, Conditions, Standards
Bureaucracy
Terrorist Threat Assessment of Art Galleries: A Guide to Theory and Practice
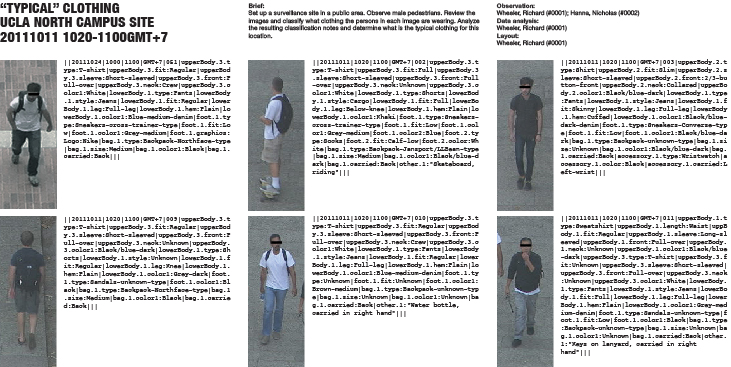
“Typical” Clothing UCLA North Campus Site 20111011 1020-1100GMT+7